The other day I wanted to find out how much it costs to rent an apartment in each city block.
When taking a quick look at available OpenStreetMap data, I was able to get the locations and boundaries of administrative regions, buildings and streets but not boundaries of each individual block within a city.
Simply plot the streets and convert them to polygons at intersections? It was not as straightforward as I thought it would be.
In this blog post, I'll talk about using QGIS software to explore and visualize LARGE maps and
provide a Python script (you don't need QGIS for this) for converting lines that represent streets to polygons that represent city blocks.
The script will use the polygonize function from Shapely but you need to preprocess the OSM data first which is the secret sauce.
Throughout this post I will be using the GeoJSON format since it's easy to use with JavaScript maps libraries. I didn't know about GeoJSON before and I never looked at the spec and you don't have to either.
Mapzen Metro Extracts
Go to Mapzen Metro Extracts and search for the city of interest.
In my case, I'm using the data for Riga, Latvia
Download the dataset split by geometry type in GeoJSON format.
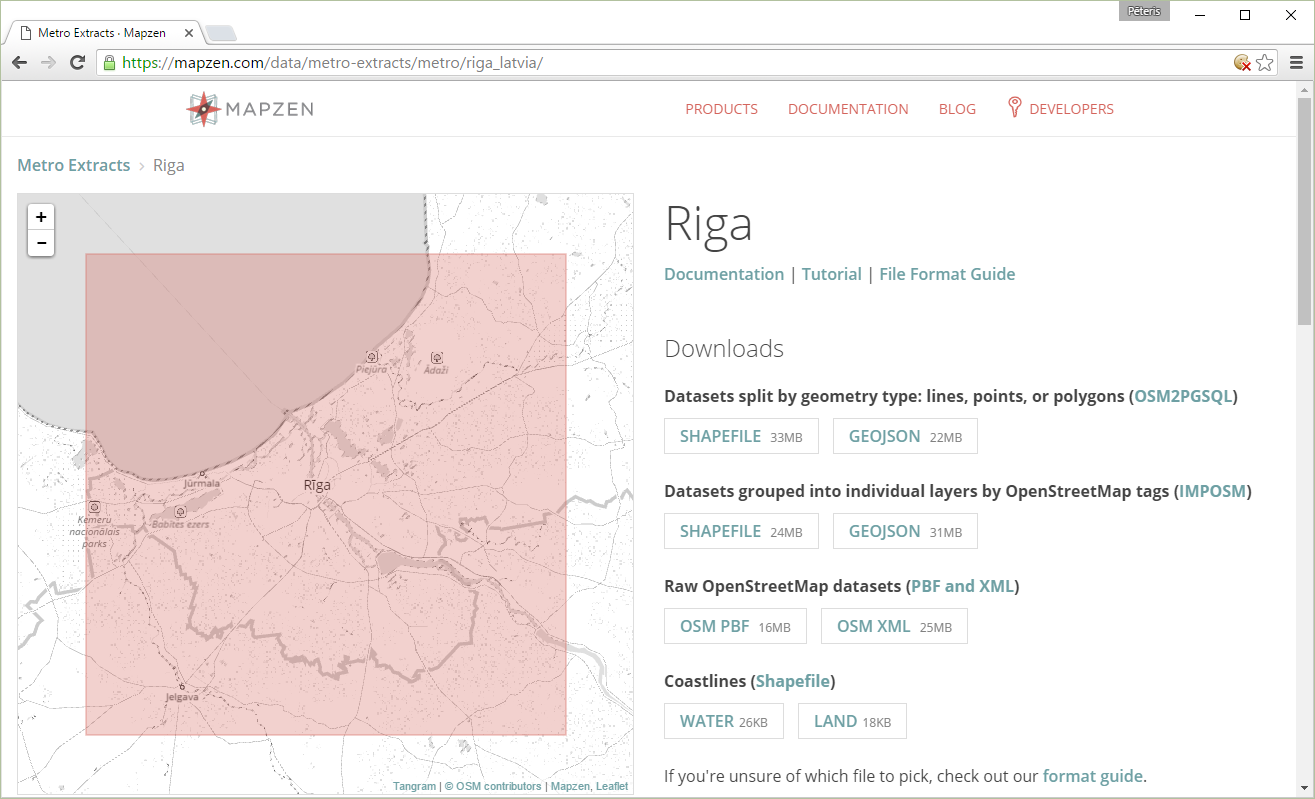
Extract the zip file. You will have three files.
riga_latvia_osm_line.geojson
riga_latvia_osm_point.geojson
riga_latvia_osm_polygon.geojson
The riga_latvia_osm_line.geojson file is the one we are going to use.
QGIS
QGIS is an open source desktop software package for editing maps on your computer.
You don't strictly need it (you can skip this section and scroll down to the code).
In fact, I found about it at the end of my journey and was using geojson.io to visually see polygons in my browser. But geojson.io will struggle with any substantial amount of data so QGIS is much better suited for playing with this data.
Download and install QGIS desktop. It is cross-platform software.
Open file
Launch QGIS Desktop.
Create a new project with Project -> New.
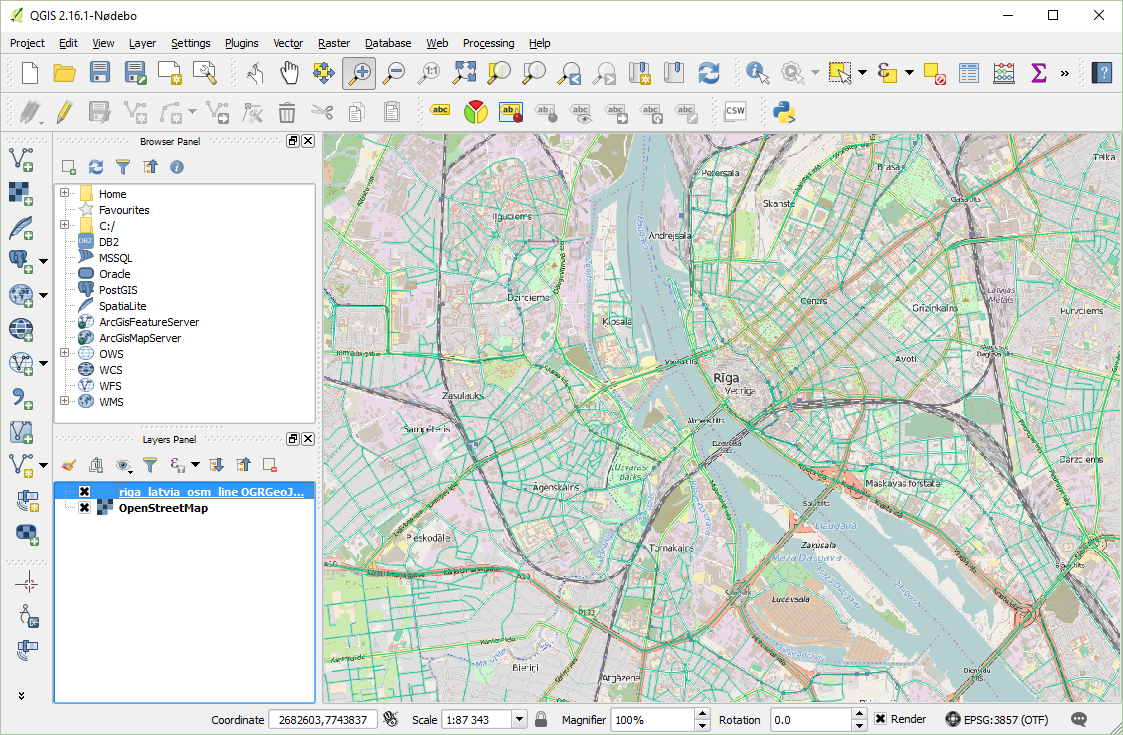
Drag & drop the riga_latvia_osm_line.geojson onto the blank canvas in QGIS.
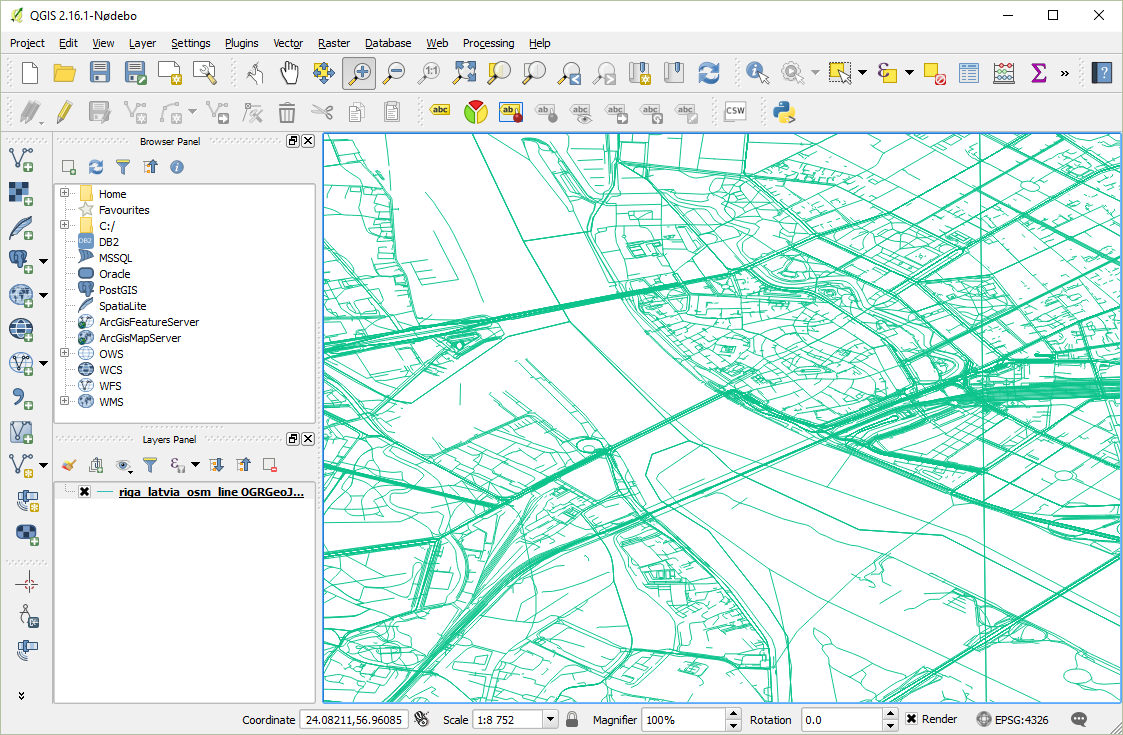
That's way too many lines.
Filter lines
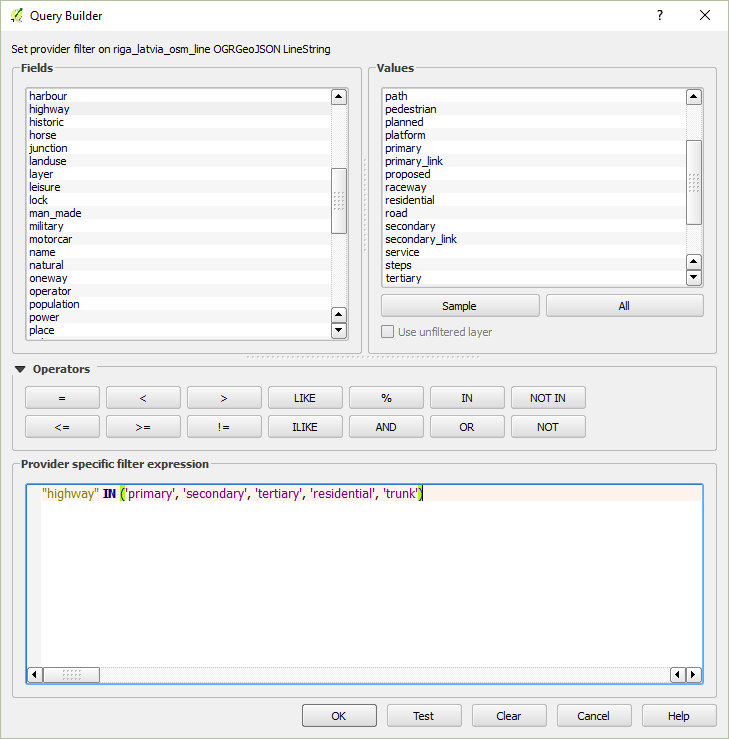
In the Layers Panel, right click on the only layer that you have and choose Filter....
In the Query Builder window, find highway in the Fields listbox and click on the All button in the Values section.
You will see all possible values for the field highway.
We are going to filter out lines that are not roads and we are only going to use major roads and exclude pedestrian paths and service roads, etc.
Here is a sample query that you can play with. You could also include railways, other roads, etc.
"highway" IN ('primary', 'secondary', 'tertiary', 'residential', 'trunk')
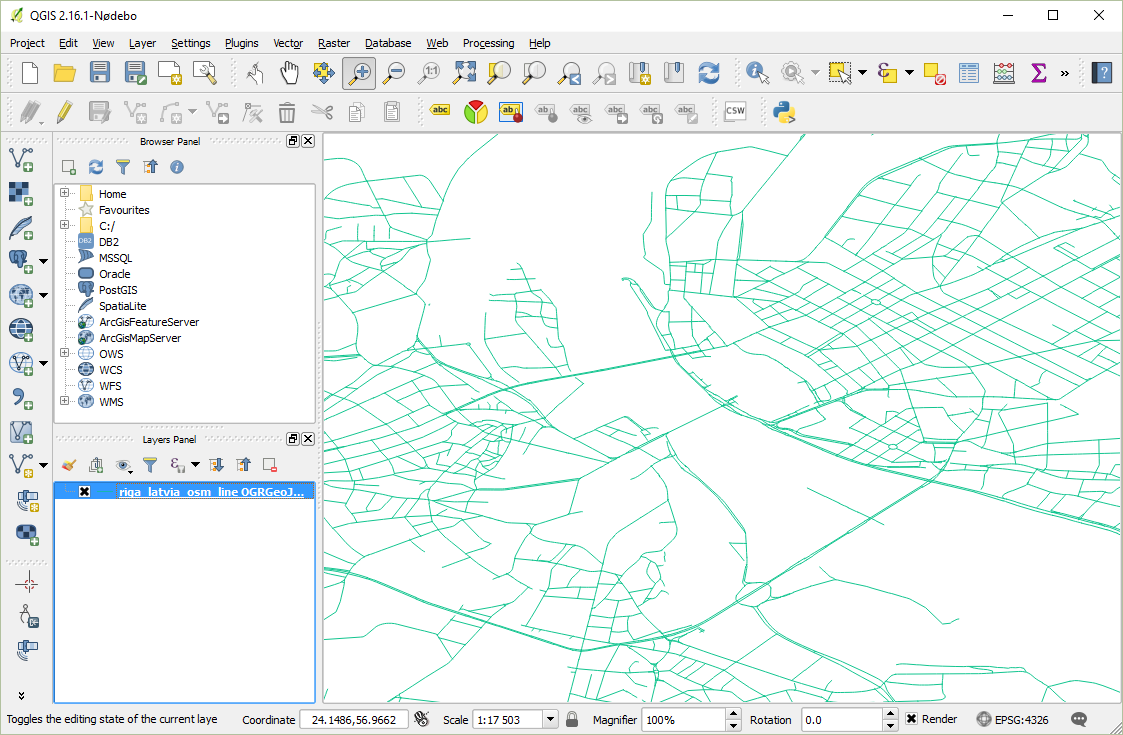
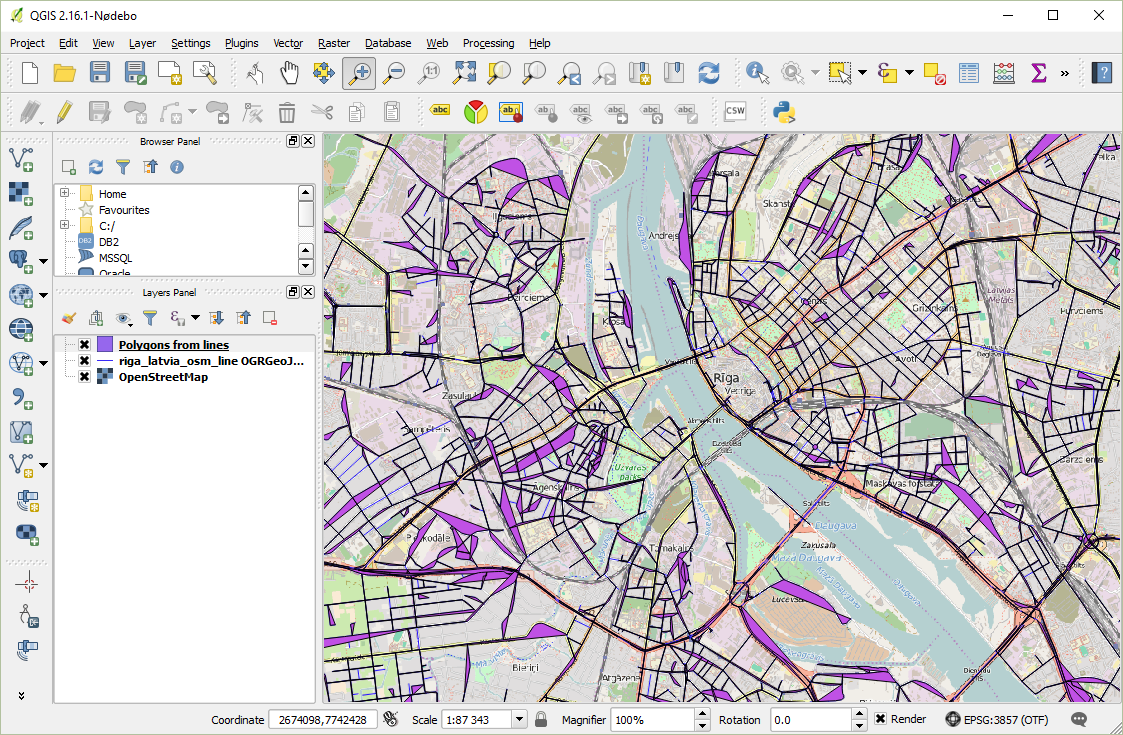
Now our map has much less detail and you can clearly see the city blocks.
Add real map layer
First, go to Plugins -> Manage and Install Plugins..., search for OpenLayers Plugin and install it.
Then go to Web -> OpenLayers plugin -> OpenStreetMap -> OpenStreetMap.
It will add a layer with OpenStreetMap.
Make sure to move your layer in the Layers Panel above the OpenStreetMap layer,
so that the lines are on top of the map and you can see them.
You could also use Google Maps or Bing Maps but I found that the streets were a little bit off.
If the lines are hard to see, you can change the line color to, say, blue to make it possible to see them better.

Or just toggle the OSM layer on or off.
Lines to polygons
There is a tool under Vector -> Geometry Tools -> Lines to polygons.
But it will likely give you poor results with OSM data.
Script
We are going to use the polygonize function from the Shapely library for Python.
But we can't use it with the downloaded data. We first need to prepare the data.
The first step is to exclude certain lines so that we don't end up with too many polygons, just likely we did with the filter function in QGIS earlier.
Then we are going to split LineStrings with many points to many LineStrings with just two points.
This is the secret sauce to make the polygonize function to work properly.
If you skip this step, the result may have many missing polygons or in the worst case look just as patchy
as the Lines to polygons tool in QGIS.
Dependencies
Install Shapely with pip
pip install shapely
If you are on Windows like me, this is not going to work.
Instead, go here and download the whl file for your Python version.
Then install it
python.exe -m pip install Shapely-1.5.16-cp35-cp35m-win_amd64.whl
Filter lines
This is similar to what we did earlier in QGIS
import sys, json

if __name__ == '__main__':

    input_filename = sys.argv[1]
    output_filename = sys.argv[2]

    highway_whitelist = {'primary', 'secondary', 'tertiary', 'residential', 'trunk'}

    streets = json.load(open(input_filename, encoding='utf-8'))
    streets['features'] = [feat for feat in streets['features'] if feat['properties']['highway'] in highway_whitelist]

    json.dump(streets, open(output_filename, 'w'))
Run it
python filter.py riga_latvia_osm_line.geojson riga_streets.tmp.geojson
The original file was 112 MB and the filtered file is now 17 MB.
If you cleared the properties (which you may not need anymore) of every feature, the file size would be even smaller.
Convert lines
This is the secret sauce.
The length of lines that represent streets are arbitrary. I guess they were added by humans manually.
Which means that a street can span multiple intersections which is my theory why the polygonize function gets confused and you get few or patchy polygons.
The solution was to split each line that consists of multiple points into multiple lines with just two points (beginning and end).
import sys, json

if __name__ == '__main__':

    input_filename = sys.argv[1]
    output_filename = sys.argv[2]

    data = json.load(open(input_filename, encoding='utf-8'))

    geojson = {
        "type": "FeatureCollection",
        "features": []
    }

    for feature in data['features']:
        coords = feature['geometry']['coordinates']
        for i in range(0, len(coords) - 1):
            geojson['features'].append({
                "type": "Feature",
                "properties": feature['properties'], # or just {}
                "geometry": {
                    "type": "LineString",
                    "coordinates": [coords[i], coords[i+1]]
                }
            })

    json.dump(geojson, open(output_filename, 'w'))
Run it
python split-lines.py riga_streets.tmp.geojson riga_streets.geojson
The file size grew from 17 MB to 98 MB.
If you uncomment the line that clears the properties field, the file size will be just 12 MB.
Polygonize lines
This script polygonize.py will read all lines from a GeoJSON file,
call the polygonize function from Shapely
and save all polygons to a GeoJSON file.
import sys
import json
from shapely.ops import polygonize
from shapely.geometry import asShape
from shapely.geometry import mapping

if __name__ == '__main__':

    input_filename = sys.argv[1]
    output_filename = sys.argv[2]

    streets = json.load(open(input_filename))

    lines = []
    for feature in streets['features']:
        lines.append(asShape(feature['geometry']))

    polys = list(polygonize(lines))

    geojson = {
        "type": "FeatureCollection",
        "features": []
    }

    for poly in polys:
        geojson['features'].append({
            "type": "Feature",
            "properties": {},
            "geometry": mapping(poly)
        })

    json.dump(geojson, open(output_filename, 'w'))
Run it
python polygonize.py riga_streets.geojson riga_polys.geojson
The final file size is just 3 MB.
Results
If you load the polygons in QGIS, it'll look like this.
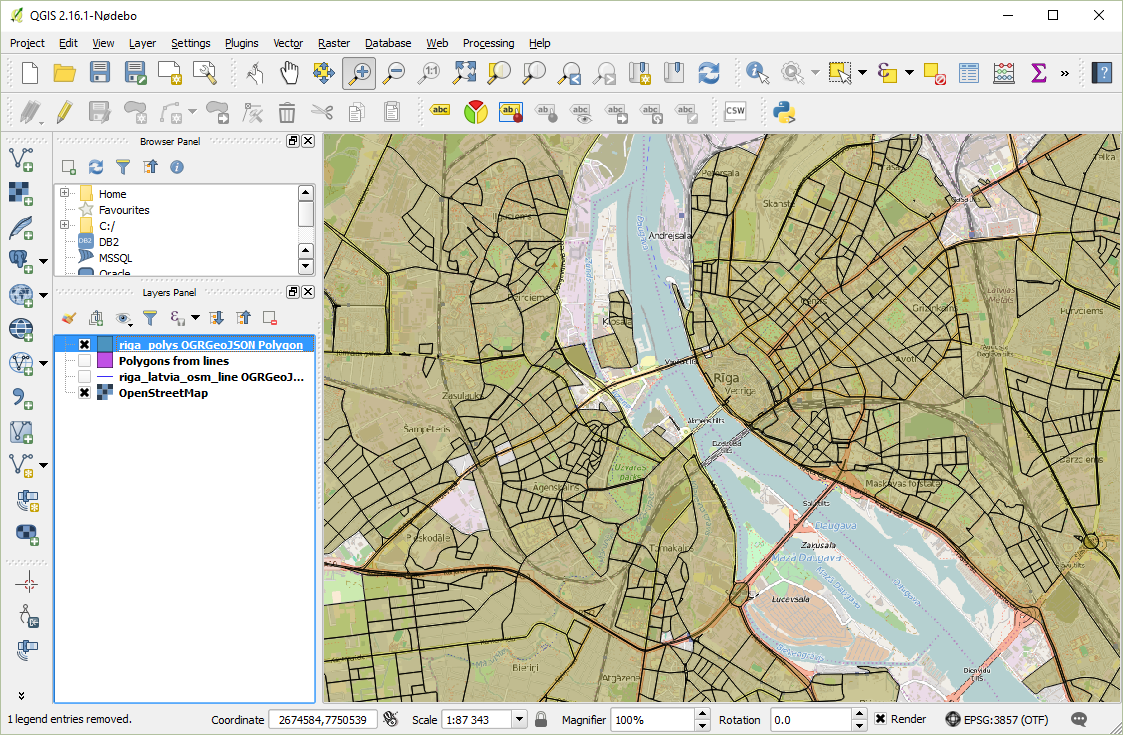
You can make the polygon layer fill color transparent by changing the opacity/alpha of the fill color under style properties.
This file is small enough so that you can open it in geojson.io which means you can also use Leaflet (a JS library for interactive maps) to add these polygons from a GeoJSON file to your map in JS.
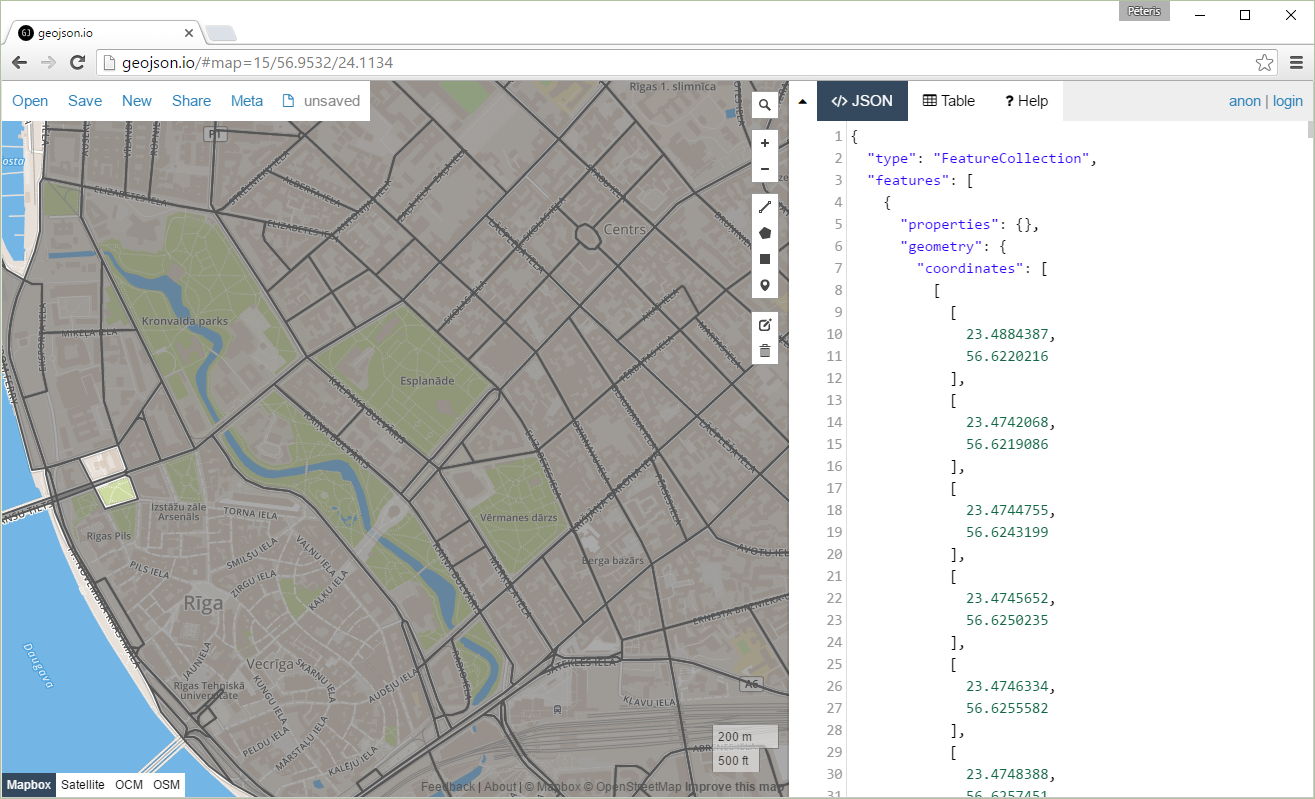
I actually found geojson.io to be much easier to use to add and delete polygons than QGIS.
Here are some polygons from Brooklyn, New York, US.
You can download the map.geojson file from this gist and
open it in geojson.io for more interactivity.
Extra
In the beginning, I attempted to do this with node.js since my visualization and data crawling was also written in JavaScript.
There is turfjs for node.js which is a collection of functions for working with GeoJSON data.
Here are some of the code that I threw out but may be useful.
Filtering lines by distance
If your downloaded map is too large and you have too many lines to show (if you are not using QGIS but sticking with geojson.io only, for example), you can exclude lines that are a certain distance from the city center.
var fs = require('fs')
var distance = require('turf-distance')
var centroid = require('turf-centroid')

var s = fs.readFileSync('riga_latvia_osm_line.geojson')
var geo = JSON.parse(s)

var cityCenter = {
    type: "Feature",
    geometry: { type: "Point", coordinates: [24.1153139,56.9570109] }
}

var highwayWhitelist = {
    "primary": true,
    "primary_link": true,
    "secondary": true,
    "secondary_link": true,
    "residential": true,
    "service": false,
    "tertiary": true,
    "tertiary_link": true,
    "trunk": true,
    "trunk_link": true,
}

for (var key in geo.features) {
    var feat = geo.features[key]
    var keep = false

    if (highwayWhitelist[feat.properties.highway]) {
        var lineCenter = centroid(feat)
        var d = distance(cityCenter, lineCenter) // km
        if (d <= 3.5) {
            keep = true
        }
    }

    if (!keep) {
        delete geo.features[key]
    } else {
        delete feat.properties
        feat.properties = {}
    }
}

var lines = geo.features.filter(f => !!f) //.slice(0, 10000)
The same code In Python with Shapely.
from shapely.geometry import Point
from shapely.geometry import asShape, mapping
import json

center = Point(24.1153139, 56.9570109)
max_distance_from_center = 0.033 # not meters or kilometers !!!
highway_whitelist = {'primary', 'secondary', 'tertiary', 'residential', 'trunk'}

data = json.load(open('riga_latvia_osm_line.geojson', encoding='utf-8'))

for feature in data['features']:
    if feature['properties']['highway'] in highway_whitelist:
        line = asShape(feature['geometry']) # inverse: mapping(line)
        distance = center.distance(line.centroid)
        if distance < max_distance_from_center:
            lines.append(feature)

# use mapping(obj) to convert a shapely object to GeoJSON
Filtering lines by polygon
This piece of code will filter out lines that are not part of a polygon (an administrative boundary within a city, for instance).
That's accomplished by splitting each line into 100 meter segments and checking if the center point of a segment is within that polygon. I couldn't find a function that checks if a line intersects with a polygon so this was my quick workaround.
var fs = require('fs')
var centroid = require('turf-centroid')
var lineChunk = require('turf-line-chunk')
var gju = require('geojson-utils')

var region = {
  "type": "FeatureCollection",
  "features": [
    {
      "type": "Feature",
      "properties": {},
      "geometry": {
        "type": "Polygon",
        "coordinates": [
          [
            [ 24.011306762695312, 57.07750772096635 ],
            ...
        ]
      }
    }
  ]
}.features[0]

for (var key in geo.features) {
    var feat = geo.features[key]
    var keep = false

    if (highwayWhitelist[feat.properties.highway]) {
        var segments = lineChunk(feat, 0.1, 'kilometers')
        segments.features.forEach(seg => {
            if (keep) return
            var lineCenter = centroid(seg)
            if (gju.pointInPolygon(lineCenter.geometry, region.geometry)) {
                keep = true
            }
        }
    }

    if (!keep) {
        delete geo.features[key]
    } else {
        delete feat.properties
        feat.properties = {}
    }
}
Summary
- Download GeoJSON files from Mapzen Metro Extracts
- Filter lines with
filter.py - Split
LineStrings with multiple points toLineStringswith two points withsplit-lines.py - Create polygons with
polygonize.py - Look at results with QGIS or geojson.io
So this may not be perfect and if you have any suggestions I am open to them.