Let's say you have a bunch of lines and you would like to extrapolate (guess data points beyond the range of the data set) them.
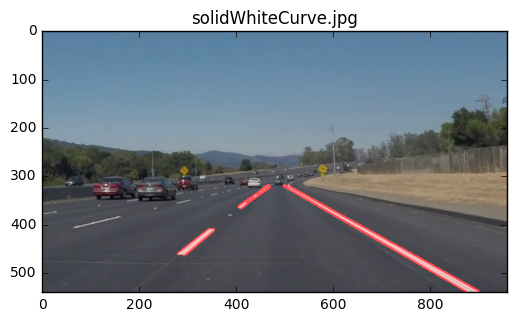
I had to figure this out for the Udacity Self-driving Car Nanodegree P1 Line Detection task.
For simplicity, I am going to use these lines.
import matplotlib.pyplot as plt
import numpy as np

lines = [
  (50, 50, 40, 35),
  (52, 52, 42, 37),
  (38, 30, 25, 15),
]

for x1, y1, x2, y2 in lines:
    plt.plot((x1, x2), (y1, y2), 'g')

plt.axis([0, 60, 0, 60])
plt.show()
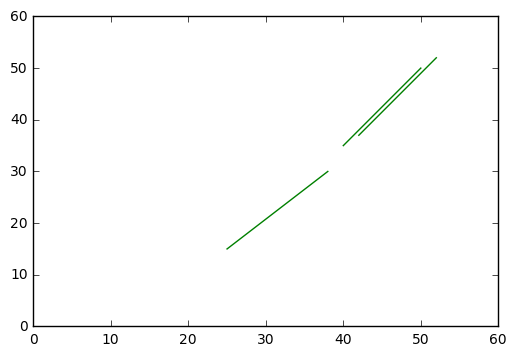
The goal is to have one straight line from the top right corner to all the way down.
First, separate x and y points.
x = []
y = []
for x1, y1, x2, y2 in lines:
    x += [x1, x2]
    y += [y1, y2]
Then we can use np.polyfit to fit a line to these points. A straight line can be represented with y = mx + b which is a polynomial of degree 1.
z = np.polyfit(x, y, 1)
print(z)
We'll get
[ 1.40241735 -21.23284749]
which are the coeficients for y = mx + b, so m=1.40241735 and b=-21.23284749.
m, b = z
Let's plot this line.
for i in range(min(x), max(x)):
    plt.plot(i, i * m + b, 'go')

plt.show()
numpy has a handy function np.poly1d which can do the y = mx + b calculation for us.
z = np.polyfit(x, y, 1)
f = np.poly1d(z)

for i in range(min(x), max(x)):
    plt.plot(i, f(i), 'go')

plt.show()
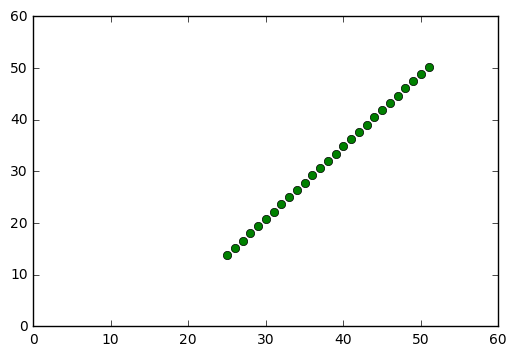
Instead of using range, we could also use numpy's np.linspace to generate a number of points for us.
x_new = np.linspace(min(x), max(x), 10).astype(int)
y_new = f(x_new).astype(int)
points_new = list(zip(x_new, y_new))

print(points_new) # [(25, 13), (28, 18), (31, 22), (34, 26), (37, 30), (40, 34), (43, 39), (46, 43), (49, 47), (52, 51)]
print(len(points_new)) # 10

for x, y in points_new:
    plt.plot(x, y, 'ro')

plt.show()
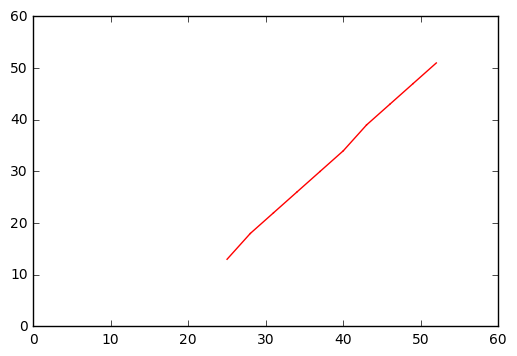
We could plot these points as lines as follows:
for i in range(1, len(points_new)):
    px, py = points_new[i-1]
    cx, cy = points_new[i]
    plt.plot((px, cx), (py, cy), 'r')

plt.show()
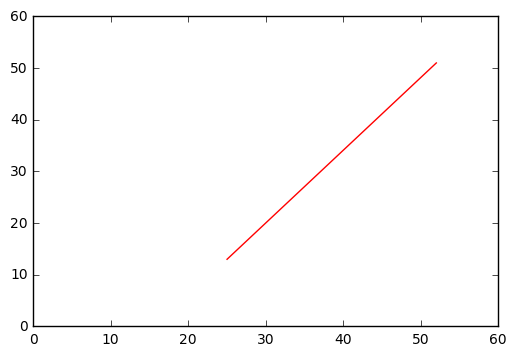
Or make it just one straight line because that's what we ultimately want.
px, py = points_new[0]
cx, cy = points_new[-1]

plt.plot((px, cx), (py, cy), 'r')
plt.show()
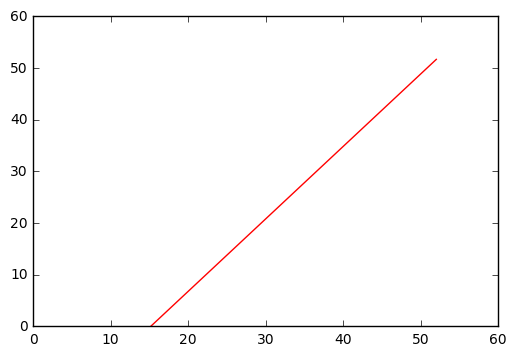
If return to the original question, how do we extrapolate the lines?
Since we got a straight line, we can simply plug in points that are outside of our data set.
z = np.polyfit(x, y, 1)
f = np.poly1d(z)

plt.plot((0, max(x)), (f(0), f(max(x))), 'r')

plt.axis([0, 60, 0, 60])
plt.show()
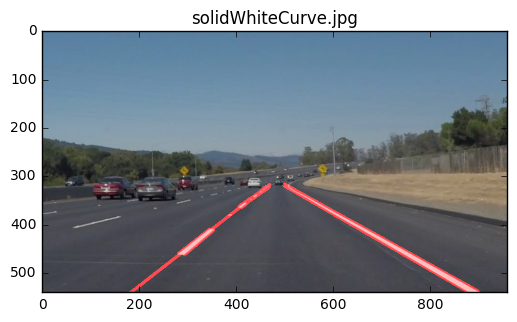
When applied to the original task, it would like like this.
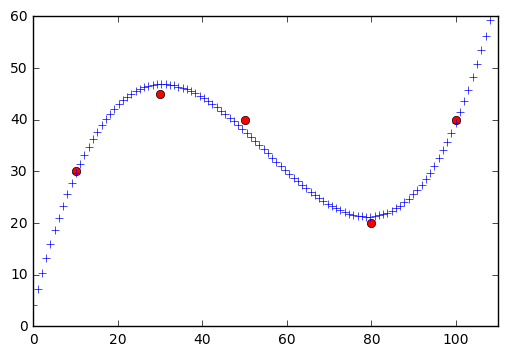
By the way, np.polyfit can also fit more complex lines. This time we need at least a polynomial of degree 3.
x = [10, 30, 50, 80, 100]
y = [30, 45, 40, 20,  40]

for x1, y1 in zip(x, y):
    plt.plot(x1, y1, 'ro')

z = np.polyfit(x, y, 3)
f = np.poly1d(z)

for x1 in np.linspace(0, 110, 110):
    plt.plot(x1, f(x1), 'b+')

plt.axis([0, 110, 0, 60])
plt.show()